Effluent Treatment Plant Design: Flow, Units and Layout
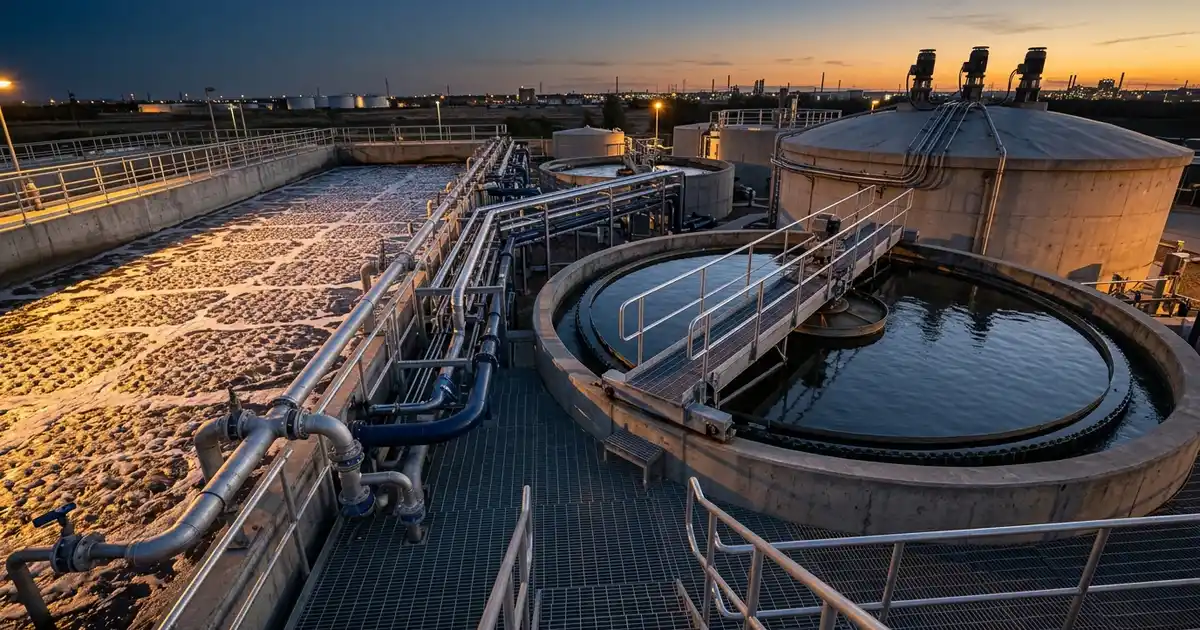
A factory that needs an effluent treatment plant has to give its designer a flow, a load and a discharge standard before any tank can be sized. An effluent treatment plant (ETP) is a set of treatment units that brings a factory's wastewater to the standard required for discharge or reuse. Effluent treatment plant design turns those inputs into a process route, sized units and a layout that fits the site. This guide covers the design basis, the process flow, the sizing logic for each stage, the plant layout and the failures that appear when a step is skipped. It draws on World Bank Group guidance and on US, Indian and EU rules, and each rule is labelled by jurisdiction. The approach reflects the effluent treatment plant engineering work that Global Formulation supports, from stream characterisation to start-up.
Effluent Treatment Plant Design Starts with the Design Basis
Every later decision rests on four inputs: the flow, the load, how both vary, and the standard the treated water must meet. A plant sized on the wrong inputs fails however well its equipment is built. The design basis records the four inputs, and where each came from, in one document that the owner, the designer and the contractor all accept. The subsections below take them in turn.
Flow: average, peak and the batch pattern
Flow has three values that matter: the daily average, the peak and the minimum. The average sets storage volume and running cost, while the peak sets the hydraulic capacity of channels, pumps and clarifiers. The minimum shows how low the load on the biology falls between batches, and a batch plant discharges in pulses. Metering the real discharge over a production cycle, or building a flow balance from the process, is the first design task, since batch patterns matter more than daily totals.
The World Bank Group's General Environmental, Health, and Safety (EHS) Guidelines, hosted by the International Finance Corporation (IFC), list the sources an industrial site has to account for. They are process wastewater, wastewater from utility operations, runoff from process and materials-staging areas, and miscellaneous streams such as laboratory and workshop wastewater. Utility streams are easy to overlook, and the guidelines name cooling towers and demineralisation systems among them. Our guides to cooling tower water treatment and boiler water treatment cover the water chemistry behind those streams.
Load: what is in the water, stream by stream
Load is flow multiplied by concentration, and it is measured for each stream before the streams are mixed. The IFC guidelines list what industrial wastewater can carry, from acids or bases and oxygen-depleting organics to metals, cyanide, oily materials and heat. For each stream the sampling programme reports pH, biochemical oxygen demand (BOD), chemical oxygen demand (COD), suspended solids, dissolved solids, oil and grease, nitrogen, phosphorus and any named toxicant. Analytical methods follow a recognised reference such as Standard Methods for the Examination of Water and Wastewater, 24th edition (2023).
The same guidelines say that monitoring of batch or seasonal processes should take time-dependent variation into account. They point to more frequent or composite sampling for highly variable effluents, although composite sampling is not appropriate for every analyte, such as those that are short-lived or volatile. A single grab sample from one shift records one moment of a variable discharge.
The standard: where the treated water goes sets how clean it must be
The discharge or reuse standard is an input to the design, not a result of it. Regulators set it by industry, by receiving medium or by both, and the route the water takes changes the target. Three jurisdictions show the pattern. The design basis names the one that governs the site.
- United States — the US Environmental Protection Agency (EPA) develops national, technology-based effluent guidelines industry by industry. Standards for direct dischargers go into National Pollutant Discharge Elimination System (NPDES) permits issued by states and EPA regional offices. Indirect dischargers, which send wastewater to a publicly owned treatment works, work under pretreatment controls. For plants that make organic chemicals, plastics and synthetic fibers, the relevant rule is the Organic Chemicals, Plastics and Synthetic Fibers (OCPSF) guideline in 40 CFR Part 414.
- India — Schedule VI of the Environment (Protection) Rules, 1986 sets general effluent standards in Part A. It has separate columns for inland surface water, public sewers, land for irrigation and marine coastal areas, and the permitted BOD differs between the columns. Its guidelines apply the public-sewer column only where the sewer leads to a secondary treatment system that includes biological treatment. The Central Pollution Control Board also publishes industry-specific effluent standards, including for paint, pesticide and pharmaceutical manufacture.
- European Union — permit conditions for chemical installations under Directive 2010/75/EU rest on best available techniques (BAT). Commission Implementing Decision (EU) 2016/902 of 30 May 2016 adopted the BAT conclusions for common waste water and waste gas treatment and management systems in the chemical sector. Read the Decision itself for what applies to a given installation.
The IFC guidelines add an international reference point. They state that process discharges should not be diluted, before or after treatment, to meet a discharge or ambient water quality standard. Whatever the jurisdiction, the design basis names the rule or permit, the receiving medium and the point where compliance is measured. Our water and wastewater engineering page sets the wider context for these choices.
A worked illustration: why flow and load size different units
Flow sizes the hydraulic units, such as channels, pumps and clarifiers, while load sizes the biological and chemical units. The invented figures below show how a batch discharge changes the numbers a designer works from. They describe no real plant. Take a plant that discharges 120 m³ of wastewater per day at an average COD of 3,000 mg/L.
| Quantity | Working | Result |
|---|---|---|
| Daily COD load | 120 m³/day × 3,000 g/m³ (1 mg/L equals 1 g/m³) | 360,000 g/day, or 360 kg COD/day |
| Average flow | 120 m³/day ÷ 24 h | 5 m³/h |
| Peak flow if all of it leaves in one 8-hour shift | 120 m³ ÷ 8 h | 15 m³/h, 3 times the average |
| Peak flow if it leaves as two 60 m³ batches, each drained in 2 hours | 60 m³ ÷ 2 h | 30 m³/h, 6 times the average |
| Equalisation working volume for one 60 m³ batch, drawn down at 5 m³/h | 60 m³ − (5 m³/h × 2 h) | 50 m³, before allowances |
| Steady COD load to the biology after equalisation | 360 kg/day ÷ 24 h | 15 kg COD/h |
With equalisation in place, the biology receives 15 kg of COD every hour, so its volume follows the daily load. Without it, the clarifier and the pipework see the 30 m³/h peak of the two-batch case, so their size follows the flow. An equalisation tank that passes 5 m³/h turns a six-times peak into a steady feed, which is why batch plants specify one. The working volume above is idealised, so a real design adds allowances for mixing, minimum level and margin and replaces the assumed pattern with the measured one.
Effluent Treatment Plant Process Flow Diagram: From Inlet to Discharge
An ETP process flow diagram shows the order of the stages, because each stage protects or prepares the next. The usual order is segregation and collection, preliminary treatment, equalisation and pH adjustment, physico-chemical separation, biological treatment, secondary clarification and polishing. A separate sludge line handles the solids that the separation stages and the biology produce. Figure 1 is a generic ETP plant flow chart in block form.
Why the order matters
The US EPA primer on wastewater treatment describes a similar sequence for municipal plants. Screens remove large objects that clog pumps and downstream processes, and grit chambers remove sand and small stones that wear equipment and clog aeration devices. Sedimentation then removes settleable solids, but dissolved and very fine pollutants are not removed effectively by gravity settling. Industrial plants add stages for the pollutants their own streams carry, such as oil, metals, refractory organics and high dissolved solids.
Match the treatment route to the pollutant
The IFC guidelines map each pollutant to a control principle and to the end-of-pipe technologies that apply it. The table condenses that map for ten pollutant groups. It is a starting list, because treatability testing on the real effluent decides which option works. A route is chosen per stream, which is why segregation comes first.
| Pollutant | Control principle | Common technologies |
|---|---|---|
| pH | Chemical addition and flow equalisation | Acid or base dosing, equalisation tank |
| Oil and grease | Phase separation | Dissolved air flotation, oil-water separator, grease trap |
| Settleable suspended solids | Settling and size exclusion | Sedimentation basin, clarifier, centrifuge, screens |
| Non-settleable suspended solids | Flotation and filtration | Dissolved air flotation, sand or multimedia filter, ultrafiltration, microfiltration |
| High BOD (above 2 kg/m³ in the IFC table) | Anaerobic biological treatment | Suspended-growth, attached-growth or hybrid reactors |
| Low BOD (below 2 kg/m³ in the IFC table) | Aerobic or facultative biological treatment | Suspended-growth, attached-growth or hybrid reactors |
| Non-biodegradable COD | Oxidation, adsorption, size exclusion | Chemical or thermal oxidation, activated carbon, membranes |
| Metals | Coagulation, flocculation, precipitation | Flash mix with settling, then filtration |
| Dissolved solids (TDS) | Concentration and size exclusion | Evaporation, crystallisation, reverse osmosis |
| Nutrients | Biological nutrient removal, chemical and physical methods | Aerobic and anoxic treatment, air stripping, ion exchange |
Source: condensed from Annex 1.3.1 of the World Bank Group's General EHS Guidelines, 2007 edition. The Group states that it is currently updating the guidelines.
The physico-chemical stage depends on dosing the right coagulant and polymer. Our guides to coagulant selection and polyelectrolyte flocculant selection cover the chemistry, and a jar test fixes the dose on the real effluent. The chemicals themselves belong to our water treatment vertical.
Biology is the core only when the load is biodegradable
The ratio of BOD to COD indicates how much of the organic load microorganisms can degrade, so it is the first screen for a biological stage. In the IFC table, stronger streams point to anaerobic treatment and weaker ones to aerobic treatment. The EPA primer notes that activated sludge units are relatively small but cost more to run than attached-growth processes, because the aeration system uses energy. It adds that elevated toxic compounds impair the process unless industrial chemicals are controlled through pretreatment.
Anaerobic stages produce biogas, which is flammable, so their layout and safety review follow hazardous-area practice. Where the risk warrants it, a hazard and operability (HAZOP) study reviews the biogas system and the chemical storage before construction. Our guide to the HAZOP study explains what the study involves and what the owner receives.
Polishing and reuse set the end of the train
Polishing removes what the main train leaves behind: fine solids by filtration, trace organics by activated carbon and pathogens by disinfection. Reuse targets push the train further, towards membranes and evaporation. The IFC guidelines list zero discharge design and the use of treated wastewater among the water conservation measures to include in project design. Reverse osmosis needs a protected feed, which our guide to reverse osmosis pretreatment covers.
The end of the train is therefore a decision about reuse, and it belongs in the design basis and not in a later upgrade.
Sizing the Units: What Governs Each Stage
Each unit is sized on one governing parameter, and a design review starts by asking what that parameter is and where its value came from. Hydraulic units follow the design flow. Biological and chemical units follow load or dose. The table lists the governing parameter for each stage and the evidence the owner should ask the designer to show.
| Stage | Governing parameter | Ask the designer to show |
|---|---|---|
| Screens and grit removal | Peak flow through the channel, and the solids and grit load | Screen opening, channel velocity at peak and minimum flow, and where screenings go |
| Oil-water separation | Free oil load and the flow through the separator | Oil and grease results by stream, and how skimmed oil is removed and stored |
| Equalisation tank | Variation of flow and load over the production cycle | The measured inflow pattern, the working volume, the mixing and the level control |
| pH adjustment | Acid or base demand from a titration of the real effluent | The titration curve, the number of stages, the reagent and the control loop |
| Coagulation, flocculation and clarification | Jar-test dose, surface overflow rate and solids loading | The jar-test report, the chosen dose, the overflow rate at peak flow and the sludge estimate |
| Dissolved air flotation | Hydraulic loading, solids and oil load, and air-to-solids ratio | The basis for the air ratio, and how the float is skimmed and handled |
| Aerobic biological treatment | Organic load, sludge age, temperature and nutrient balance | The load calculation, the sludge age, the oxygen demand at peak load and the standby blower |
| Secondary clarifier | Surface overflow rate and solids loading at peak flow | The overflow rate at peak flow, and the return and waste sludge rates |
| Anaerobic reactor | Volumetric COD loading, sulphate, toxicity and temperature | The loading, the toxicity check, and the biogas collection and safe use or flaring |
| Filtration, carbon and disinfection | Hydraulic loading and contact time | The quality target for the polished water and the contact times |
| Sludge thickening and dewatering | Sludge quantity, solids concentration and disposal route | A sludge balance by source, and the hazardous or non-hazardous classification |
Two checks are quick to run. Recompute each load as flow multiplied by concentration, using the design basis. Confirm that a standby item exists for each machine whose failure would stop the plant, such as the blowers and the dosing pumps. For the full sizing equations, see Metcalf & Eddy's Wastewater Engineering: Treatment and Resource Recovery (5th edition). The Water Environment Federation's Manual of Practice 8, Design of Water Resource Recovery Facilities (6th edition), is the second standard reference.
ETP Plant Layout: Hydraulic Profile, Access and Odour Control
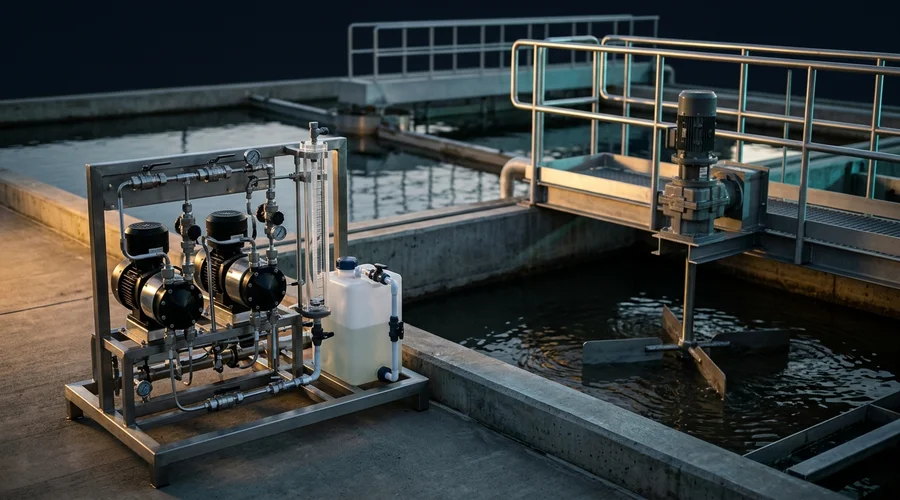
An ETP plant layout places the units on the site so that water moves through them with as little pumping as possible. Operators reach every item, and the plant stays clear of neighbours. The layout follows the process flow and the hydraulic profile, not the other way round, and it is checked against site levels, utilities and boundaries. The same principles apply to the layout of wastewater treatment plant units of any size.
Start from the hydraulic profile
The hydraulic profile is a drawing of the water level through each unit at design flow, showing the head lost between units. It fixes the relative elevation of the tanks, so it fixes where gravity flow works and where a pump station is needed. Each lift costs energy and adds a machine to maintain, so the layout puts the units in process order and uses the site slope where there is one. The profile is checked at peak flow, because that is where levels rise and tanks overflow.
Zoning, access and maintenance
Group the plant into zones: the liquid treatment train, the chemical storage and dosing area, the sludge handling area, and the control room with its electrical equipment. Chemical stores sit in bunded areas close to the dosing points, and incompatible chemicals are kept in separate bunds. The sludge area sits at the end of the train and near the site road, so trucks collect cake without crossing the process area. Every machine needs clear access for lifting and removal, with laydown space beside blowers, pumps and presses.
On a brownfield site the free space and the existing pipe routes decide what the layout can be. A 3D laser scan records them, as our guide to 3D laser scanning explains. Where the ETP is one part of a larger site, its position follows the site plan, which our site master planning and plant layout service covers.
Odour, emissions and safe entry
Wastewater treatment can release hydrogen sulphide, methane, volatile organic compounds and bioaerosols. The IFC guidelines add that odours from treatment facilities are a nuisance to workers and the surrounding community. Equalisation, sludge and anaerobic units therefore sit where emissions can be captured and the prevailing wind carries odour away from offices and the site boundary. The guidelines also list falls into tanks and confined space entries among operator hazards, so the layout provides edge protection and a defined way to isolate and enter each tank.
Stormwater, monitoring points and room to grow
Keep stormwater out of the process wastewater system, because the IFC guidelines state that stormwater should be separated from process and sanitary wastewater to reduce the volume to treat. Provide sampling points at the final discharge and at upstream points before streams merge, since the guidelines describe sampling stations at both. Leave room for the next stage, whether a second biological train, a polishing step or a reuse unit, and keep spare head in the hydraulic profile for it. Add a holding volume for spills and upsets so that off-specification flow can be held and fed back at a controlled rate.
Small ETP Plant Design: What Changes at Low Flow
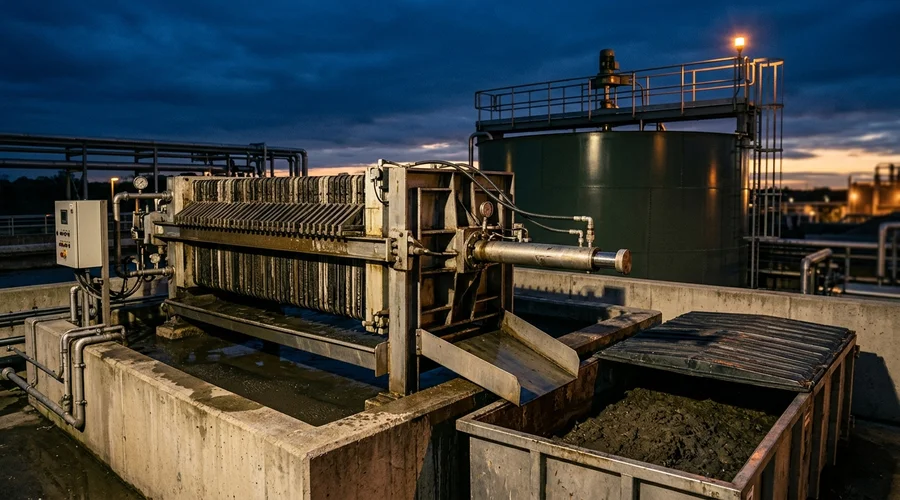
Small ETP plant design follows the same sequence as a large plant: design basis, process route, sizing and layout. What changes is that a few batches or washdowns can dominate the daily flow, so the peak-to-average ratio is high, and that operator skill weighs more heavily. The IFC guidelines state that treatment performance depends strongly on the technical ability and training of the operating staff. A small plant therefore needs a process that the site's own operators can run and maintain.
- Equalise generously — a small biological unit has less volume to dilute a shock load, so the equalisation volume comes from the measured batch pattern.
- Segregate the concentrated stream — a concentrated, toxic or high-salinity stream is treated on its own, so it does not inhibit the biology or enlarge every unit downstream.
- Consider batch biology — a sequencing batch reactor fills, reacts, settles and draws in one tank, so it needs no separate clarifier. The EPA primer lists it among the suspended-growth processes.
- Fix the sludge route early — decide whether sludge is dewatered on site or removed as a liquid for treatment elsewhere, because the choice changes footprint and operating cost.
What Goes Wrong in ETP Design: Failure Modes and Fixes
Failures that appear in operation have causes in the design basis, the process route or the layout. Fixing them after construction costs more than fixing them on paper. Each row of the table links a mistake to the consequence the owner sees and the step that prevents it. Reading the table against a proposed design is a quick review.
| What goes wrong | Consequence | How to prevent it |
|---|---|---|
| Design basis taken from a single grab sample | The plant is sized for one moment of a variable discharge, so some days overload it | Sample across the production cycle, using composite samples where the analyte allows |
| Batch discharges sent straight to treatment | Peak flow carries solids out of the clarifier and shocks the biology | Provide an equalisation tank sized from the batch pattern, with mixing |
| Concentrated or toxic stream mixed into the main flow | The biology is inhibited and every downstream unit grows | Segregate the stream, test its treatability and treat it separately |
| Sludge system sized late | Sludge accumulates, and the plant must stop or remove liquid sludge | Estimate sludge by source in the mass balance, classify it, and size thickening and dewatering with the rest |
| Hydraulic profile not closed at peak flow | Tanks overflow, or extra pump stations appear during construction | Draw the profile at peak flow before the layout is fixed |
| Odour sources placed near offices or the boundary | Complaints from workers and neighbours | Place emitting units downwind, and cover and vent them where capture is needed |
| No sampling point at the discharge or where streams merge | Compliance cannot be shown, and a fault cannot be traced to a stream | Provide sampling points at the final discharge and upstream of each merge |
| Dilution used to meet the limit | The pollutant load discharged is unchanged, and the IFC guidelines state that discharges should not be diluted for this purpose | Design to meet the standard on the treated stream itself |
| Wrong discharge route assumed | The target changes, for example when an Indian public sewer lacks secondary treatment and the surface-water standards apply | Confirm the route and the permit with the authority at the design-basis stage |
| No access for equipment removal | A blower or press change-out needs demolition or a long shutdown | Show lifting routes and laydown space on the layout |
A sampling programme across the production cycle and treatability testing on the real effluent address the first three rows before any equipment is ordered. A test run on a mixed, averaged sample hides the stream that causes the trouble, so the tests are run stream by stream and on the blend.
Commissioning an Effluent Treatment Plant Design: An Owner's Checklist
An owner who briefs a designer well gets comparable proposals and a design that can be checked. The brief is short, and every line removes a later argument. Work through the eight items below before inviting proposals. The list applies whether the plant is bought as a package, as a turnkey project or through a design-then-build route.
- State the standard — name the rule or permit, the receiving medium, the jurisdiction and the point where compliance is measured.
- Supply measured flow — give the average, peak and minimum, and the batch pattern over a production cycle.
- Supply stream data — give the composition of each stream, sampled across the production cycle, with the analytical methods used.
- Require segregation and treatability testing — ask for bench tests on the real effluent before the process route is fixed.
- Give the site constraints — state the available area, levels, utilities, prevailing wind, boundary distances and the position of the process plant.
- Fix the sludge route — state the disposal route and the hazardous or non-hazardous classification under local rules.
- Define the operation — state the staffing and skills, and require an operating philosophy and a standby and spares list.
- Define performance verification — agree the sampling points, the tests, the test duration and the acceptance criteria for start-up.
On delivery the owner should receive the following documents:
- the design basis document, with the source of every input;
- the mass balance and stream table;
- the block flow diagram, the process flow diagram and the piping and instrumentation diagrams (P&IDs);
- the hydraulic profile and the sizing calculations;
- the equipment list and datasheets;
- the plot plan and general arrangement;
- the control philosophy and the sludge balance;
- the operating and maintenance manual and the start-up test plan.
To check the work, recompute two loads from the stream table and redraw the hydraulic profile at peak flow. Count the standby items, find the sampling points on the drawings, and compare the sludge estimate with the dewatering capacity. The delivery route changes who carries design risk, as our guide to the turnkey project contract structure explains, and our EPC and EPCM project management service covers the alternatives.
Owners who want an effluent treatment plant designed on measured streams can start from our effluent treatment plant engineering service. It covers stream characterisation, treatability testing, process design, sludge handling and start-up support, built around the discharge or reuse limits. The checklist above is the brief to bring to that conversation.
Frequently Asked Questions
What is effluent treatment plant design?
Effluent treatment plant design is the engineering work that turns a factory's wastewater data into a treatment plant. It fixes the design basis, the process route, the size of each unit and the layout on the site.
The aim is treated water that meets the discharge or reuse standard that applies to the site.
What data is needed to design an ETP?
The designer needs measured flow, with the average, peak, minimum and batch pattern, and the composition of each stream. The discharge or reuse standard, the receiving medium and the site constraints complete the design basis.
Where measurements do not exist, a sampling programme across the production cycle comes first.
What are the main stages of an effluent treatment plant?
The usual stages are screening with grit or oil removal, equalisation and pH adjustment, physico-chemical separation, biological treatment, secondary clarification and polishing. A sludge line thickens and dewaters the solids from these stages.
Which stages a given plant needs depends on what its streams contain, and treatability testing on the real effluent decides it.
How is the size of an effluent treatment plant decided?
Each unit is sized on its own governing parameter. Hydraulic units such as channels and clarifiers follow the design flow, while biological units follow the organic load and the sludge age.
Chemical dosing follows the dose found by testing the real effluent, and sludge units follow the sludge quantity.
What does an ETP plant layout include?
An ETP plant layout shows the units in process order on a plot plan, with the hydraulic profile, pipe routes, chemical and sludge areas, and the control room. It also shows access for lifting and maintenance, sampling points and the separation of stormwater.
The layout is checked against site levels, utilities and boundaries.
Why is an equalisation tank needed before treatment?
An equalisation tank smooths variations in flow and load before they reach the treatment units. Batch discharges can arrive at several times the average flow, and a steady feed protects the clarifiers and the biology.
The IFC guidelines list flow equalisation as a control option for pH and for temperature.
What is the difference between an ETP and an STP?
An ETP treats industrial effluent, which is wastewater from manufacturing and utility operations, while a sewage treatment plant (STP) treats domestic sewage. The IFC guidelines separate industrial wastewater from the sanitary wastewater of site employees, which comes from domestic sewage, food service and laundry facilities.
A factory can have both, and the guidelines recommend segregating wastewater streams so that each suits its selected treatment option.
Does the discharge route change the design?
Yes, because the standard depends on where the water goes. In the United States, direct dischargers work to NPDES permits and indirect dischargers work under pretreatment controls.
In India, Schedule VI lists separate standards for inland surface water, public sewers, land for irrigation and marine coastal areas.
Can an existing ETP be upgraded instead of replaced?
An upgrade starts by comparing the measured performance of the plant with its design basis. The comparison shows whether the cause is a flow or load that has changed, a unit that is undersized or a stream that should be segregated.
Targeted changes such as equalisation, segregation, aeration or polishing can then be designed.
Need an Effluent Treatment Plant Designed or Reviewed?
Global Formulation supports effluent treatment plant design from stream characterisation and treatability testing through process design, sludge handling and start-up support, built around your discharge or reuse limits.
Discuss Your ETP Project